Here’s how to use some of the new features in Windows 7’s Event Viewer to investigate a slow boot time.

Overview
Windows 7’s Event Viewer includes a new category of event logs called Applications and Services Logs, which includes a whole host of subcategories that track key elements of the operating system. The majority of these subcategories contain an event log type called Operational that is designed to track events that can be used for analyzing and diagnosing problems. (Other event log types that can be found in these subcategories are Admin, Analytic, and Debug; however, describing them is beyond the scope of this article.)
Now, within the operating system section is a subcategory titled Diagnostic-Performance with an Operational log that contains a set of a Task Category called Boot Performance Monitoring. The Event IDs in this category are 100 through 110. By investigating all the Event ID 100 events, you will be able to find out exactly how long it took to boot up your system every time since the day you installed Windows 7. By investigating all the Event ID 101 thru 110 events, you will be able to identify all instances where boot time slowed down.
Getting started
You can find and launch Event Viewer by opening the Control Panel, accessing the System and Security category, selecting the Administrative Tools item, and double-clicking the Event Viewer icon. However, you can also simply click the Start button, type Event in the Start Search box, and press Enter once Event Viewer appears and the top of the results display.
Creating a Custom View
Once you have Event Viewer up and running, you can, of course, drill down through the Applications and Services Logs and locate the Diagnostic-Performance Operational log and begin manually looking through the events recorded in the log. However, you can save yourself time and energy by taking advantage of the new Custom View feature, which is essentially a filter that you can create and save.
To do so, pull down the Action menu and select the Create Custom View command. When you see the Create Custom View dialog box, leave the Logged option set at the default value of Any Time and select all the Event level check boxes. Next, select the By Log option button, if it is not already selected, and click the dropdown arrow. Then, drill down through the tree following the path: Applications and Services Logs | Microsoft | Windows | Diagnostics-Performance. When you open the Diagnostics-Performance branch, select the Operational check box, as shown in Figure A.
Figure A
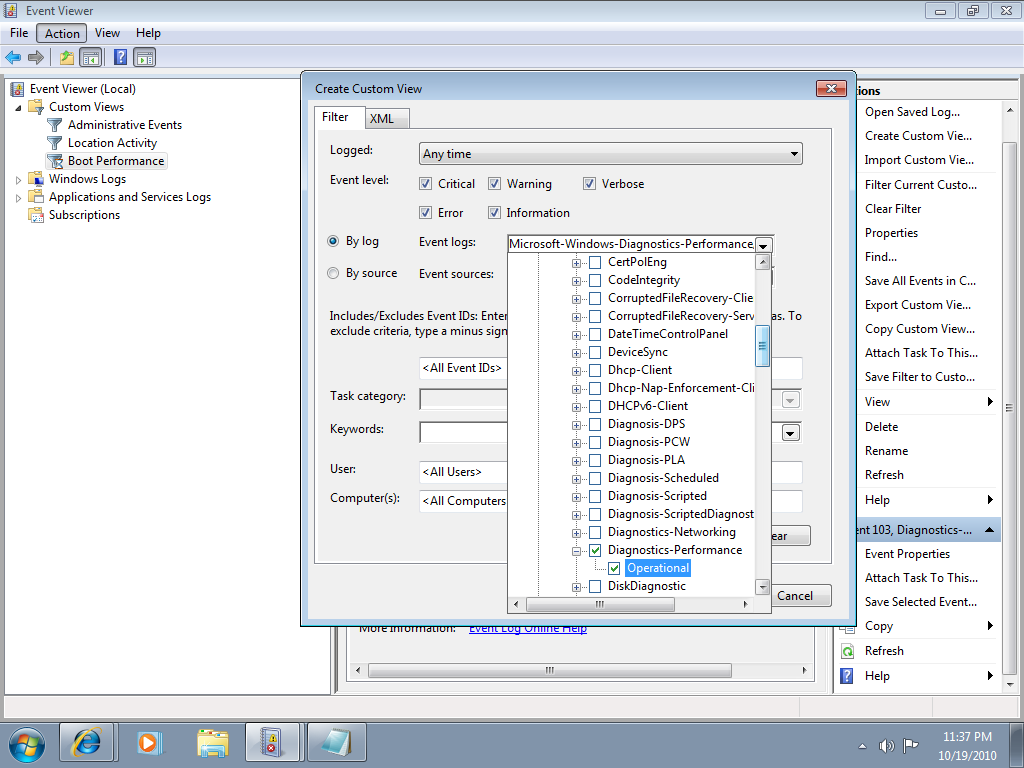
When you get to the Diagnostics-Performance branch, select the Operational check box.
To continue, type 100 in the Includes/Excludes Event IDs box, as shown in Figure B, and then click OK.
Figure B
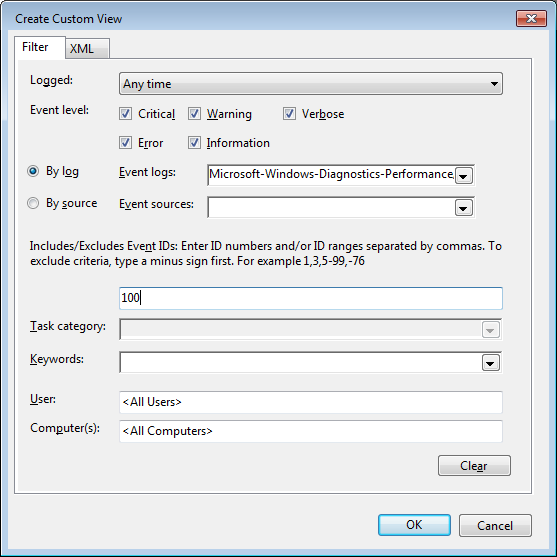
Event ID 100 records how long it takes to boot up your system.
When you see the Save Filter to Custom View dialog box, enter a name, as shown in Figure C, and click OK.
Figure C
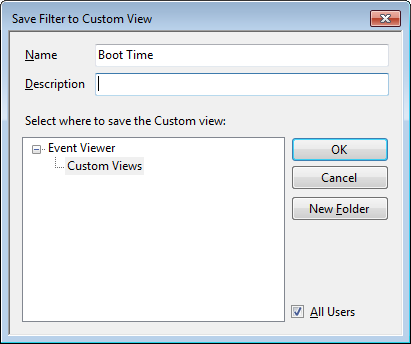
To save the filter as a Custom View, simply provide an appropriate name, such as Boot Time.
You’ll now repeat these steps and create another Custom View, and this time, you’ll type 101-110 in the Includes/Excludes Event IDs box and name it Boot Degradation.
Investigating Boot Time
To investigate your Windows 7 system’s boot time, select Boot Time in the Custom Views tree and then sort the Date and Time column in ascending order. When you do, you’ll see a complete history of every time you have booted your system since the day you installed Windows 7. In Figure D, you can see that we have hidden the Console Tree and the Action Pane to focus on the events.
Figure D
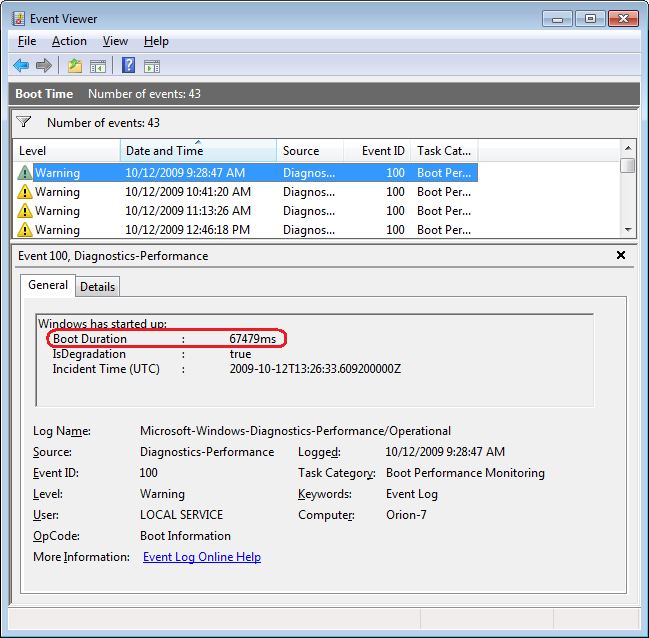
By sorting the Date and Time column in ascending order, you’ll see a complete history of every time you have booted your system since the day you installed Windows 7.
As you can see, the first recorded Boot Time on my sample system was 67479 milliseconds in October 2009. Dividing by 1,000 tells me that it took around 67 seconds to boot up. Of course, this was the first time, and a lot was going on right after installation. For example, drivers were being installed, startup programs were being initialized, and the SuperFetch cache was being built. By December 2009 the average boot time was around 37 seconds.
In any case, by using the Boot Time Custom View, you can scroll through every boot time recorded on your system. Of course, keep in mind that there will be normal occurrences that may lengthen the boot time, such as when updates, drivers, and software is installed.
Now, if you click the Details tab, you’ll see the entire boot process broken down in an incredible amount of detail, as shown in Figure E. (You can find more information about the boot process in the “Windows On/Off Transition Performance Analysis” white paper.) However, for the purposes of tracking the boot time, we can focus on just three of the values listed on the Details tab.
Figure E
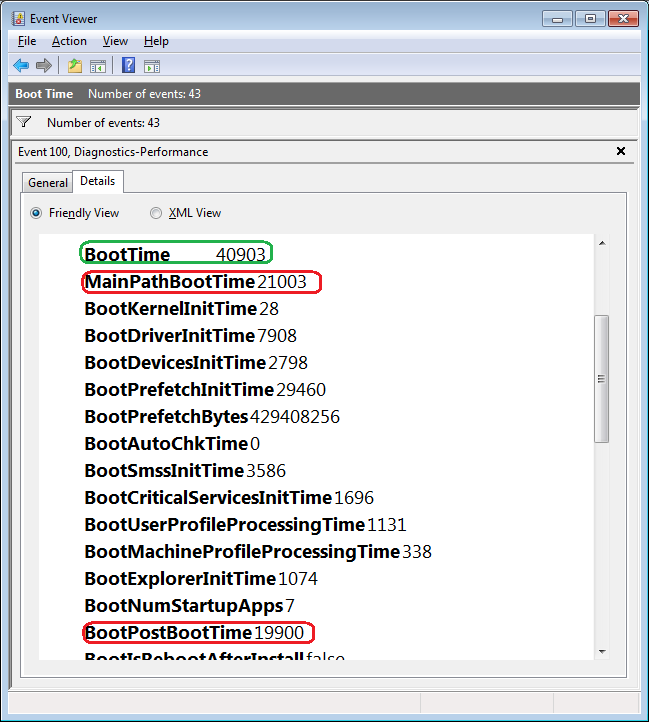
The Details tab contains an incredible amount of detail on the boot time.
MainPathBootTime
MainPathBootTime represents the amount of time that elapses between the time the animated Windows logo first appears on the screen and the time that the desktop appears. Keep in mind that even though the system is usable at this point, Windows is still working in the background loading low-priority tasks.
BootPostBootTime
BootPostBootTime represents the amount of time that elapses between the time that the desktop appears and the time that you can actually begin using the system.
BootTime
Of course, BootTime is the same value that on the General tab is called Boot Duration. This number is the sum of MainPathBootTime and BootPostBootTime. Something that we didn’t tell you before is that Microsoft indicates that your actual boot time is about 10 seconds less that the recorded BootTime. The reason is that it usually takes about 10 seconds for the system to reach an 80-percent idle measurement at which time the BootPostBootTime measurement is recorded.
Investigating Boot Degradation
To investigate instances that cause Windows 7 system’s boot time to slow down, select Boot Degradation in the Custom Views tree and then sort Event ID column in ascending order. Each Event ID, 101 through 110, represents a different type of situation that causes degradation of the boot time.
While there are ten different Event IDs here, not all of them occur on all systems and under all circumstances. As such, I’ll focus on the most common ones that we have encountered and explain some possible solutions.
Event ID 101
Event ID 101 indicates that an application took longer than usual to start up. This is typically the result of an update of some sort. As you can see in Figure F, the AVG Resident Shield Service took longer than usual to start up right after an update to the virus database. If you look at the details, you can see that it took about 15 seconds for the application to load (Total Time), and that is about 9 seconds longer than it normally takes (Degradation Time).
Figure F
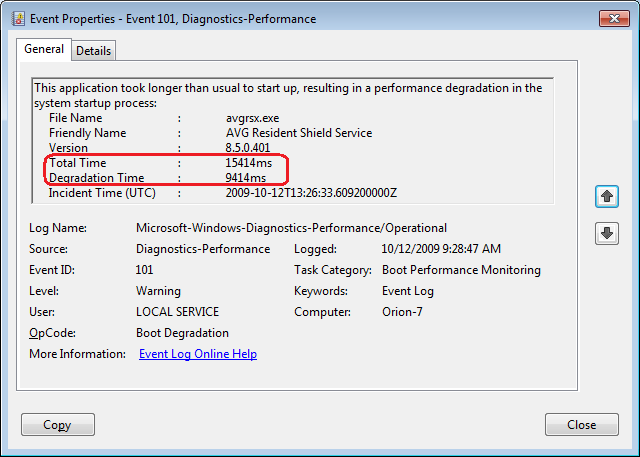
Event ID 101 indicates that an application took longer than usual to start up.
An occasional degradation is pretty normal; however, if you find that a particular application is being reported on a regular basis or has a large degradation time, chances are that there is a problem of some sort. As such, you may want to look for an updated version, uninstall and reinstall the application, uninstall and stop using the application, or maybe find an alternative.
(In the case of my friend’s Windows 7 system, there were several applications that were identified by Event ID 101 as the cause of his system slowdown. Uninstalling them was the solution, and he is currently seeking alternatives.)
Event ID 102
Event ID 102 indicates that a driver took longer to initialize. Again, this could be the result of an update. However, if it occurs regularly for a certain driver or has a large degradation time, you should definitely look in to a newer version of the driver. If a new version is not available, you should uninstall and reinstall the driver.
Event ID 103
Event ID 103 indicates that a service took longer than expected to start up, as shown in Figure G.
Figure G
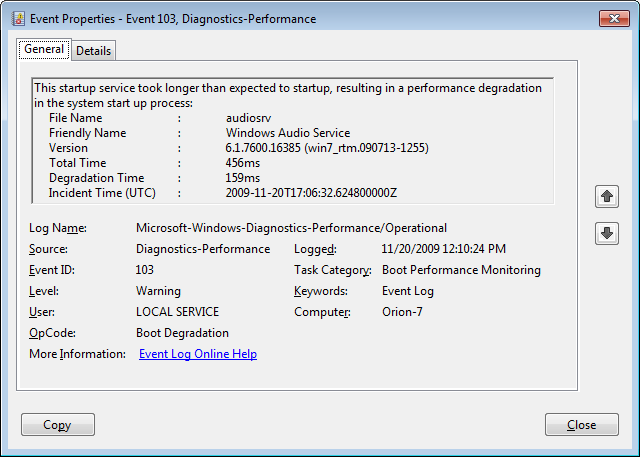
Event ID 103 indicates that a service took longer than expected to start up.
Services can occasionally take longer to start up, but they shouldn’t do so on a regular basis. If you encounter a service that is regularly having problems, you can go to the Services tool and experiment with changing the Startup type to Automatic (Delayed Start) or Manual.
Event ID 106
Event ID 106 indicates that a background optimization operation took longer to complete. On all the Windows 7 systems that we investigated, this event identified the BackgroundPrefetchTime as the culprit, as shown in Figure H. Since the Prefetch cache is a work in progress, this should not really represent a problem.
Figure H
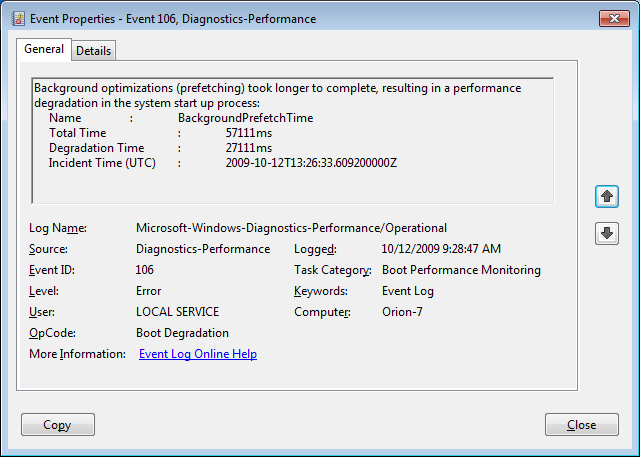
Event ID 106 indicates that a background optimization operation took longer to complete.
If you encounter regular or long degradation times related to Prefetch, you may want to investigate clearing this cache and allowing the operating system to rebuild it from scratch. However bear in mind that doing so can be tricky and instructions on doing so are beyond the scope of this article.
Event ID 109
Event ID 109 indicates that a device took longer to initialize. Again, if this is happening occasionally, there shouldn’t be anything to worry about. But if it is occurring regularly, you should make sure that you regularly back up your hard disk and begin investigating replacing the device in question.
Have questions?
Get answers from Microsofts Cloud Solutions Partner!
Call us at: 856-745-9990 or visit: https://southjerseytechies.net/
South Jersey Techies, LL C is a full Managed Web and Technology Services Company providing IT Services, Website Design Services, Server Support, Network Consulting, Internet Phones, Cloud Solutions Provider and much more. Contact for More Information.
To read this article in its entirety click here.